RIOT
- Service:
- Web App
- Industry:
- Web development
- Time-frame:
- 1 year
- Team size:
- 3 developers
Technologies used
The Risk Impact Opportunities Tool (RIOT) is a Python application that allows users to generate environment risk hypotheses about various economic entities and portfolios of those entities based on a bottom-up analysis of their environmentally relevant assets.
Summary
Our clients are the representatives of the University of Oxford, and we are deeply honored to work with them. Our team is responsible for assisting the Oxford Smith School by creating a web app for The Sustainable Finance Programme. The Sustainable Finance Programme at the Oxford Smith School was established in 2012 (originally as the Stranded Assets Programme) to understand how finance and investment intersect with the environment and sustainability.
How it works
The tool relies heavily on geographic analysis and data generated by the Smith school and can facilitate the creation of various applications, such as interactive web front-end applications. With this site it is possible to identify and differentiate between firms that are more or less at risk from these factors and this can inform relationship strategies. This information can also be applied to a new project- or asset-specific transactions to arrive at a ‘risk score’ and thus facilitate an understanding of what action might need to be taken internally.
Our role
Our team is responsible for creating the functional part of the project entirely as well as to redesign the UX and UI part. The major functions of the app:
- Changing of data model architecture;
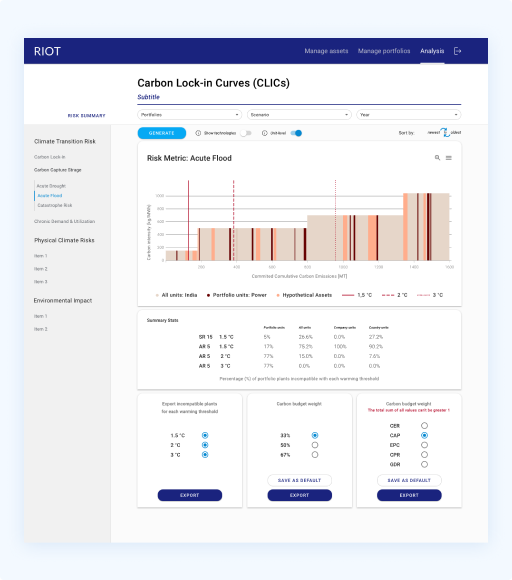
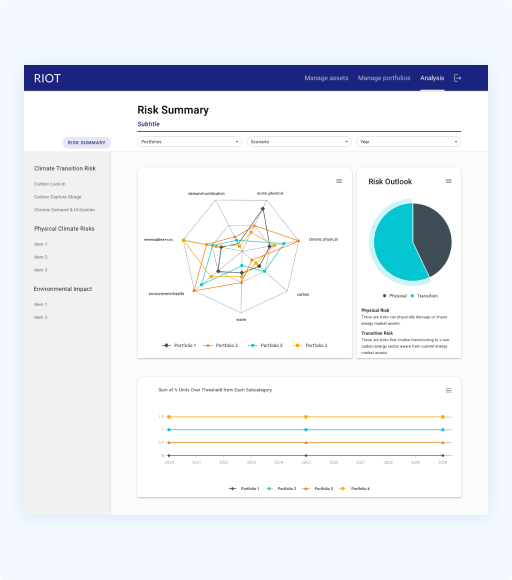
- Adding new graphics to display additional statistics;
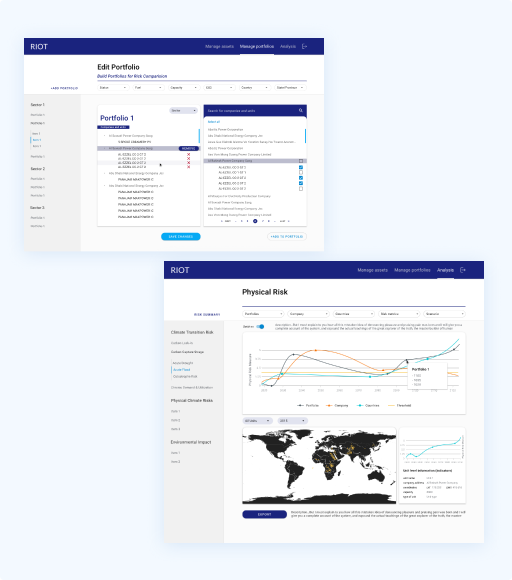
- Updating functionality of profiles (users can edit their profiles, add companies, separate departures of the company, etc.);
- Adding feature for working with own assets (users can add their own companies that are not in the database or do not even exist to get predictions);
- Creating a registration system for new users;
- Creating an additional system that gives rights to show a certain kind of content on the site (e.g. disable costing, closed data).
Challenges and results
- The biggest challenge was to work with a large amount of data. Our engineers reworked the architecture, rewrite the algorithms and added caching.
- The project included specific charts with narrow functionality. We used Highcharts to set up necessary charts, customized the existing charts and added several own plugins and functions.


